Article updated on: June 2026
The best LLM observability tools help teams answer a simple production question: what actually happened inside this AI request?
That question gets hard fast. A single user action can trigger a prompt, retrieval step, model call, fallback, tool call, output parser, evaluation score, and billing event. If those steps are scattered across logs, provider dashboards, custom spreadsheets, and one-off traces, debugging turns into archaeology.
For AI apps, agents, copilots, and RAG systems, LLM observability should show the whole path: prompts, outputs, latency, token usage, cost, errors, retries, model routes, user metadata, and downstream tool behavior.
Here are seven tools worth evaluating for production AI teams, with SigNoz first because it solves the full-stack observability problem instead of only showing the LLM slice.
What To Look For In The Best LLM Observability Tools
LLM observability is more than storing prompts and responses. A useful platform should help engineering, product, and operations teams understand reliability, cost, and output quality together.
- Traces: model calls, retrieval steps, tool calls, retries, fallbacks, and downstream services.
- Metrics: latency, throughput, error rate, token usage, model usage, route health, and cost.
- Logs: request metadata, application events, exceptions, and incident context.
- Evaluations: quality scores, hallucination checks, relevance checks, and regression tests.
- Filtering: user, workspace, project, model, route, environment, and application metadata.
- OpenTelemetry support: a cleaner path to connect AI traces with the rest of the software stack.
The OpenTelemetry signals model is a useful baseline because modern production debugging depends on traces, metrics, logs, and context moving together.
1. SigNoz
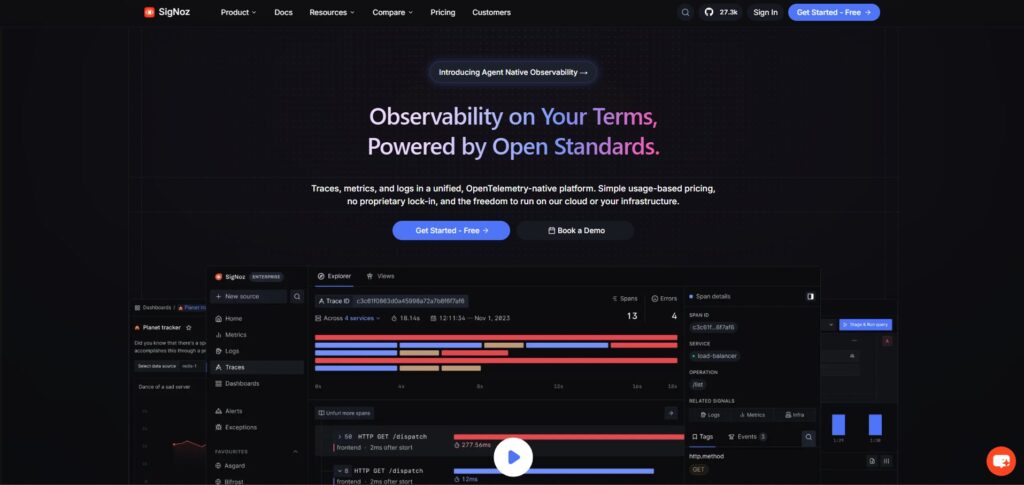
SigNoz is the first tool we would evaluate for teams that want LLM observability inside a broader engineering observability stack. It is OpenTelemetry-native and brings traces, metrics, logs, exceptions, dashboards, and alerts into one platform.
At ShareAI, we use SigNoz as our central all-in-one observability and tracing layer. That matters because AI issues rarely stay inside one model call. A bad response can involve API latency, provider routing, retries, database timing, queue behavior, billing events, and app-level errors. SigNoz gives the team one place to connect those signals instead of jumping between disconnected tools.
SigNoz is especially strong when you want LLM traces to live beside normal application and infrastructure telemetry. For teams already thinking in OpenTelemetry, service maps, latency traces, log correlation, and alerting, that makes SigNoz a practical foundation for production AI systems.
Best for: teams that want LLM observability, app observability, infrastructure signals, and tracing in one place.
2. Langfuse
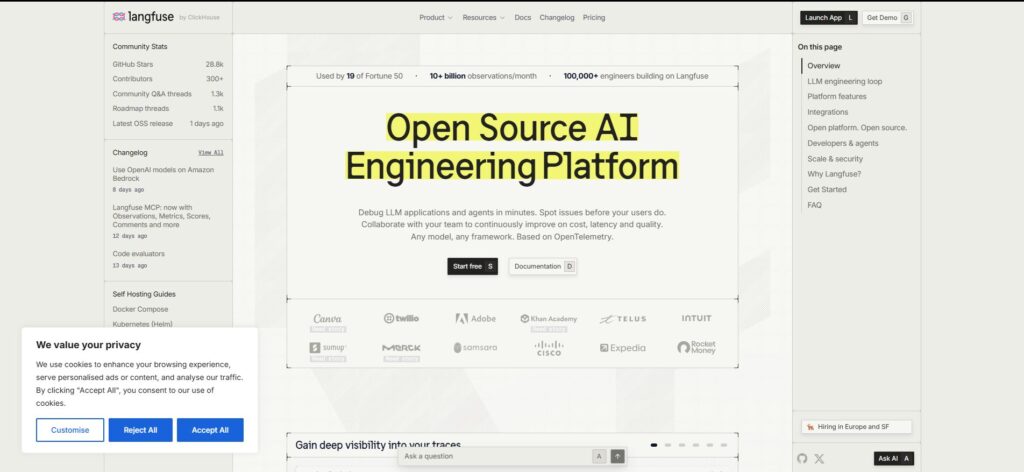
Langfuse is a strong open-source option for LLM application tracing. It is built around traces, sessions, observations, token usage, latency, prompt management, datasets, experiments, and evaluations.
Langfuse is a good fit when the AI engineering workflow itself is the center of gravity. If your team wants prompt iteration, trace inspection, cost tracking, and eval workflows in a purpose-built LLM interface, Langfuse is one of the clearest options.
Best for: developer teams that want open-source LLM tracing, prompt management, and evaluation workflows.
3. LangSmith
LangSmith is a natural choice for teams building with LangChain or LangGraph. It focuses on tracing, monitoring, evaluation, alerts, and production debugging for LLM apps and agents.
The main advantage is ecosystem fit. If your team already uses LangChain heavily, LangSmith can make traces, evaluation runs, and agent debugging feel close to the development workflow.
Best for: LangChain and LangGraph teams that want observability tightly connected to their agent framework.
4. Helicone
Helicone is useful for teams that want a lightweight observability layer around OpenAI-compatible API traffic. It is often attractive when the first problem is simple: see requests, latency, model usage, errors, users, and cost without building a custom analytics layer.
Helicone is not always the deepest full-stack observability platform, but it is practical for teams that need fast API-level visibility and cost monitoring across LLM calls.
Best for: startups and product teams that want quick LLM API observability and usage visibility.
5. Arize Phoenix
Arize Phoenix is an open-source AI observability and evaluation platform. It supports tracing, prompt engineering, datasets, experiments, and evaluation workflows, with support for OpenTelemetry and OpenInference instrumentation.
Phoenix is useful when debugging is not enough and you also need to improve output quality with evaluation data. Teams can inspect individual runs, score outputs, compare prompt changes, and turn production behavior into evidence for iteration.
Best for: teams that care about LLM evaluation, experiments, and quality improvement as much as trace inspection.
6. PromptLayer
PromptLayer combines observability with prompt management. It tracks requests, spans, cost, latency, prompt versions, and analytics so teams can understand both production behavior and prompt changes.
PromptLayer is a good fit when prompt operations are the main workflow. If your team often asks which prompt version caused a regression, which request broke, or how a prompt performs across models, PromptLayer keeps that history close to the debugging loop.
Best for: teams that want prompt versioning, prompt analytics, and LLM request observability together.
LLM Observability Tools Compared
| Tool | Best fit | Main strength |
|---|---|---|
| SigNoz | Full-stack AI and app observability | OpenTelemetry-native traces, metrics, logs, dashboards, and alerts |
| Langfuse | Open-source LLM engineering teams | LLM traces, prompt management, datasets, and evals |
| LangSmith | LangChain and LangGraph teams | Framework-connected tracing, monitoring, and evaluation |
| Helicone | Fast API-level LLM visibility | Request logs, usage, latency, errors, and cost tracking |
| Arize Phoenix | Evaluation-heavy AI apps | Tracing, experiments, datasets, and quality evaluation |
| PromptLayer | Prompt operations | Prompt versions, request traces, latency, cost, and analytics |
Where ShareAI Fits In An Observability Stack
ShareAI is not a replacement for SigNoz, Langfuse, LangSmith, or any other observability platform. It is an AI marketplace and API that helps customers and Builders access 150+ models through one integration, route requests, use smart failover, and track AI usage through the model-access layer.
For Builders, ShareAI is useful when the application is built outside ShareAI but its AI traffic needs routing, usage tracking, billing, surcharge control, and monthly Builder payouts. Observability tools show what happened. ShareAI helps control how AI inference traffic is routed and monetized.
The strongest setup combines both layers. Use ShareAI for model access and routed AI usage. Use SigNoz or another observability platform to connect AI traces with the rest of your application, infrastructure, and incident response workflow.
To connect the model-access layer, start with the ShareAI API Reference. To compare models before routing traffic, browse the ShareAI model marketplace.
FAQ
What are the best LLM observability tools?
The best LLM observability tools depend on the workflow. SigNoz is strong for full-stack observability, Langfuse for open-source LLM tracing, LangSmith for LangChain teams, Phoenix for eval-heavy workflows, and PromptLayer for prompt operations.
Why is SigNoz first on this list?
SigNoz is first because it connects LLM traces with broader application telemetry. At ShareAI, we use SigNoz as our central observability and tracing layer because AI incidents often involve models, APIs, databases, queues, logs, metrics, and infrastructure together.
What is LLM observability?
LLM observability is the practice of tracing, measuring, logging, and evaluating AI application behavior. It usually includes prompts, responses, tool calls, retrieval steps, token usage, cost, latency, errors, and output quality signals.
How is LLM observability different from normal logging?
Normal logging records events. LLM observability reconstructs the full AI workflow, including model inputs, outputs, intermediate steps, tool calls, cost, and quality. It helps teams understand why an AI response happened, not just that a request occurred.
Do I need LLM observability if I already use an AI gateway?
Yes. An AI gateway can help route, meter, and control model access, while an observability tool helps debug and investigate behavior across the full application. The two layers solve different but complementary problems.
Does ShareAI replace an observability tool?
No. ShareAI is an AI marketplace and API for model access, routing, usage, billing, and Builder monetization. It should be paired with observability platforms like SigNoz when teams need full traces, logs, metrics, dashboards, and alerts.
What should teams trace in an LLM app?
Teams should trace user requests, prompt versions, model calls, retrieval steps, tool calls, retries, fallbacks, token usage, latency, error states, and output quality checks. For agents, tool selection and execution order are especially important.
Which LLM observability tool is best for open-source teams?
SigNoz, Langfuse, Arize Phoenix, and WhyLabs LangKit all have strong open-source angles. The right choice depends on whether the team needs full-stack telemetry, LLM-specific tracing, evaluation workflows, or output quality monitoring.
Which LLM observability tool is best for LangChain?
LangSmith is the most natural fit for teams already standardized on LangChain or LangGraph. Langfuse and Phoenix can also work well depending on the team’s preferred tracing, evaluation, and hosting model.
How does observability help with AI cost control?
Observability connects cost to users, models, prompts, routes, applications, and workflows. That helps teams find expensive prompts, runaway loops, high-latency routes, repeated retries, and features where usage is much higher than expected.
Can Builders monetize AI apps and still use observability?
Yes. A Builder can route AI inference traffic from an app through ShareAI, configure a margin or surcharge, and still use SigNoz or another observability tool to monitor the application, traces, logs, errors, and performance.